Calib3D: Calibrating Model Preferences for Reliable 3D Scene Understanding
WACV 2025 - Oral Presentation
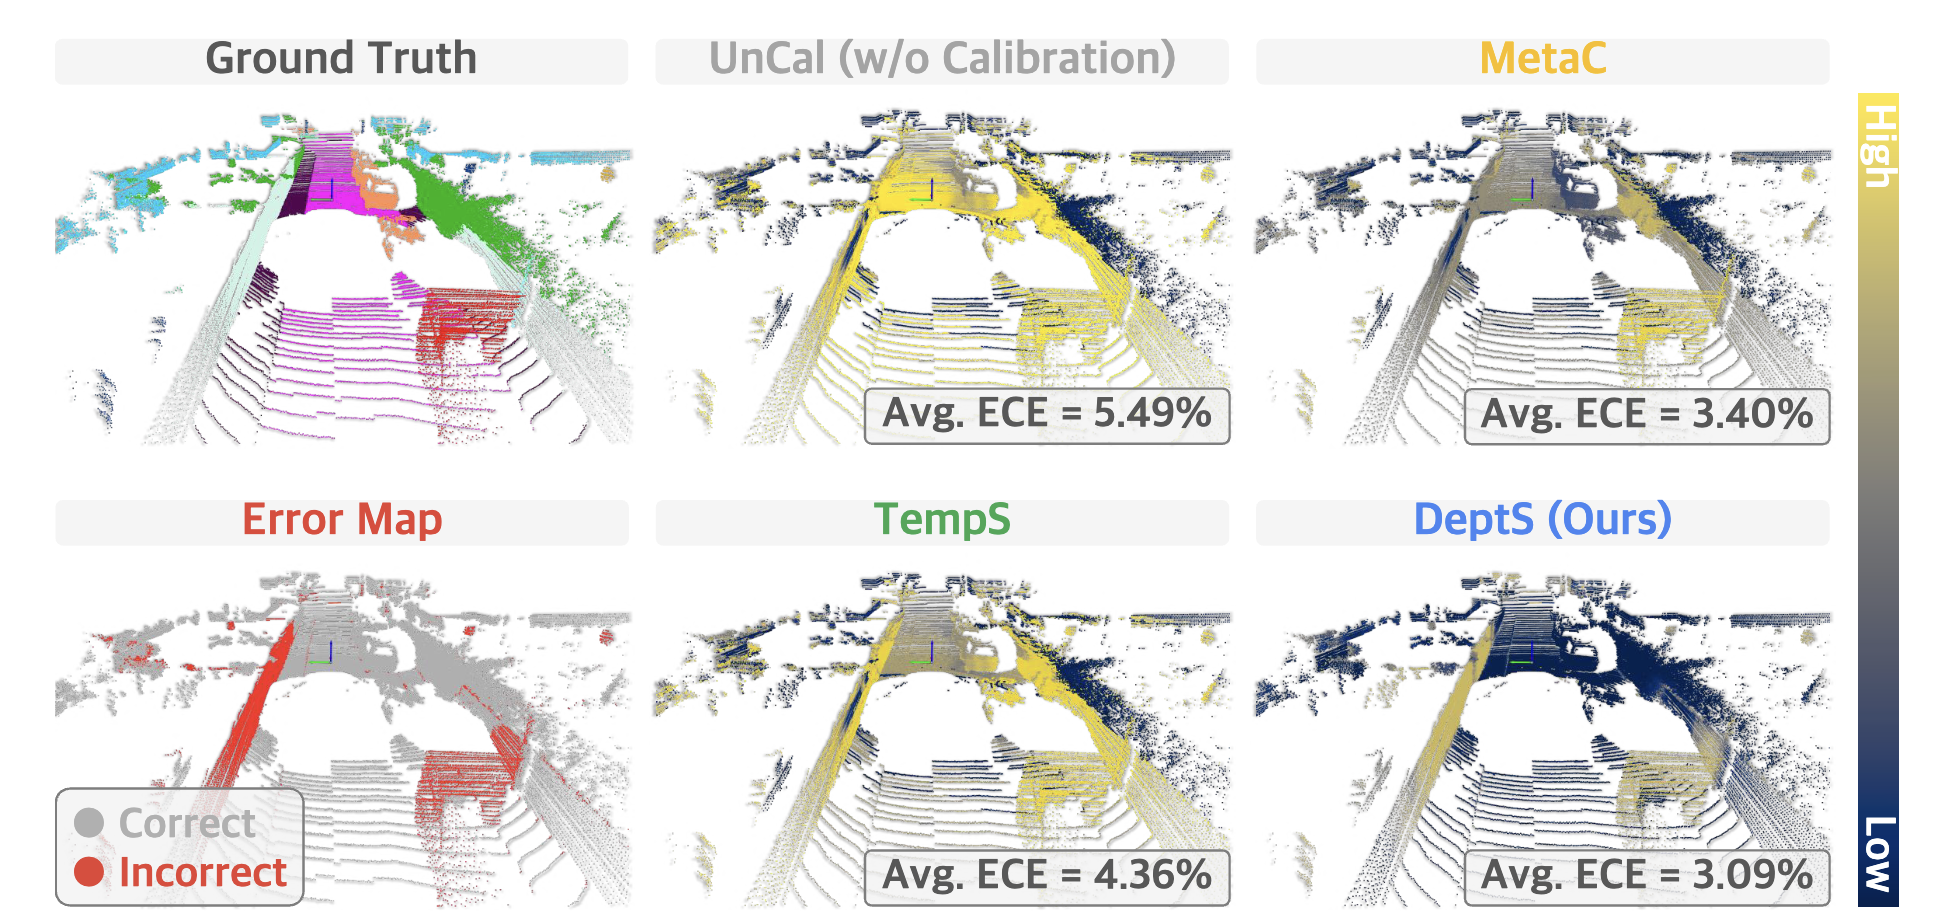
Figure 1. Well-calibrated 3D scene understanding models are anticipated to deliver low uncertainties when predictions are accurate and high uncertainties when predictions are inaccurate. Existing 3D models (UnCal) and prior calibration methods struggled to provide proper uncertainty estimates. Our proposed depth-aware scaling (DeptS) is capable of outputting accurate estimates, highlighting its potential for real-world usage. The plots shown are the point-wise expected calibration error (ECE) rates. The colormap goes from dark to light, denoting low and high error rates, respectively. Best viewed in colors.


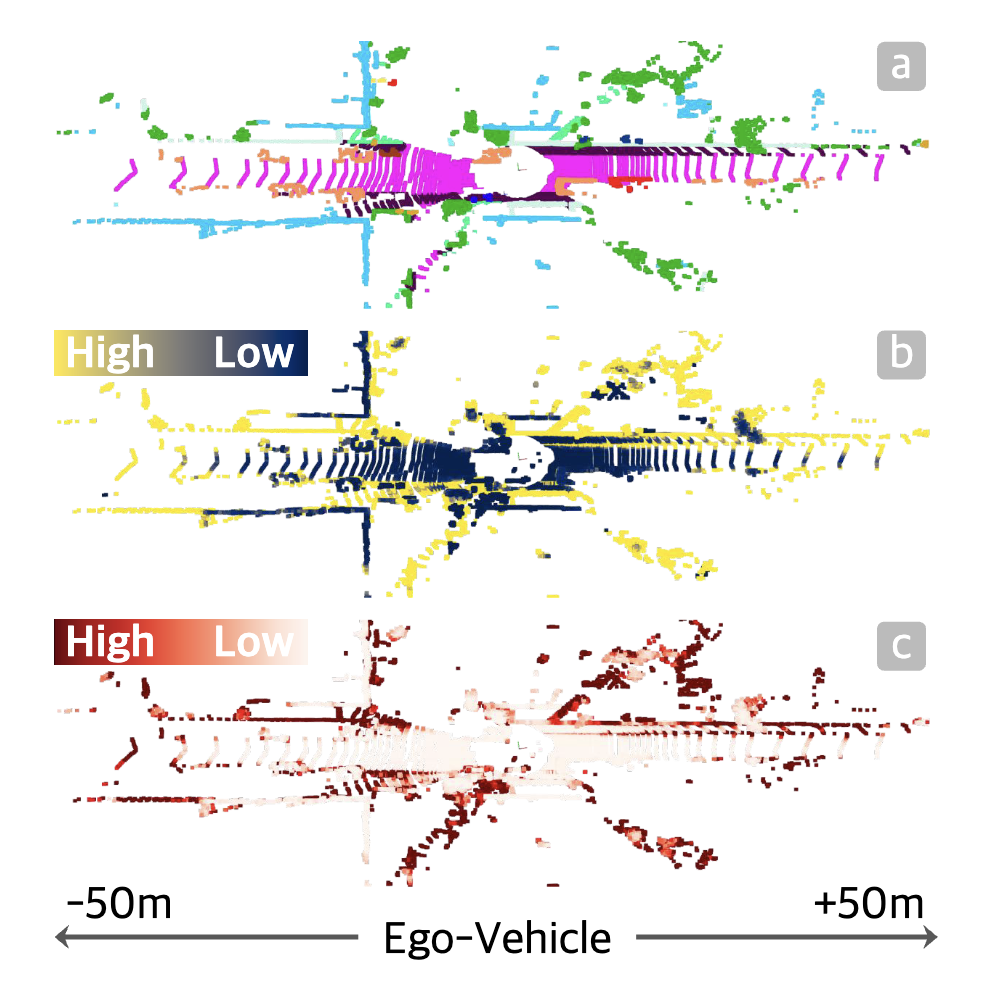 Figure 2.
Depth-correlated patterns in a ±50m LiDAR-acquired scene from the SemanticKITTI dataset.
(a) Ground truth semantics. (b) Point-wise ECE scores. (c) Point-wise entropy scores.
Figure 2.
Depth-correlated patterns in a ±50m LiDAR-acquired scene from the SemanticKITTI dataset.
(a) Ground truth semantics. (b) Point-wise ECE scores. (c) Point-wise entropy scores.
Reliable 3D Scene Understanding
This poor calibration fails to meet the demands of real-world applications, contradicting safety requirements in autonomous systems, where precise, confident predictions are critical for obstacle detection. Similar concerns exist in safety-critical areas, e.g., surveillance, healthcare, and remote sensing. Several studies have attempted to understand the reliability of image recognition models and observed insightful phenomenons. Despite these efforts, the reliability of 3D scene understanding models in providing uncertainty estimates remains underexplored. 3D data, such as LiDAR and RGB-D camera inputs, are sparser and less structured than images. Calib3D is designed to benchmark and study the reliability of 3D models through uncertainty estimation, focusing on both aleatoric and epistemic uncertainties to address real-world, safety-critical challenges.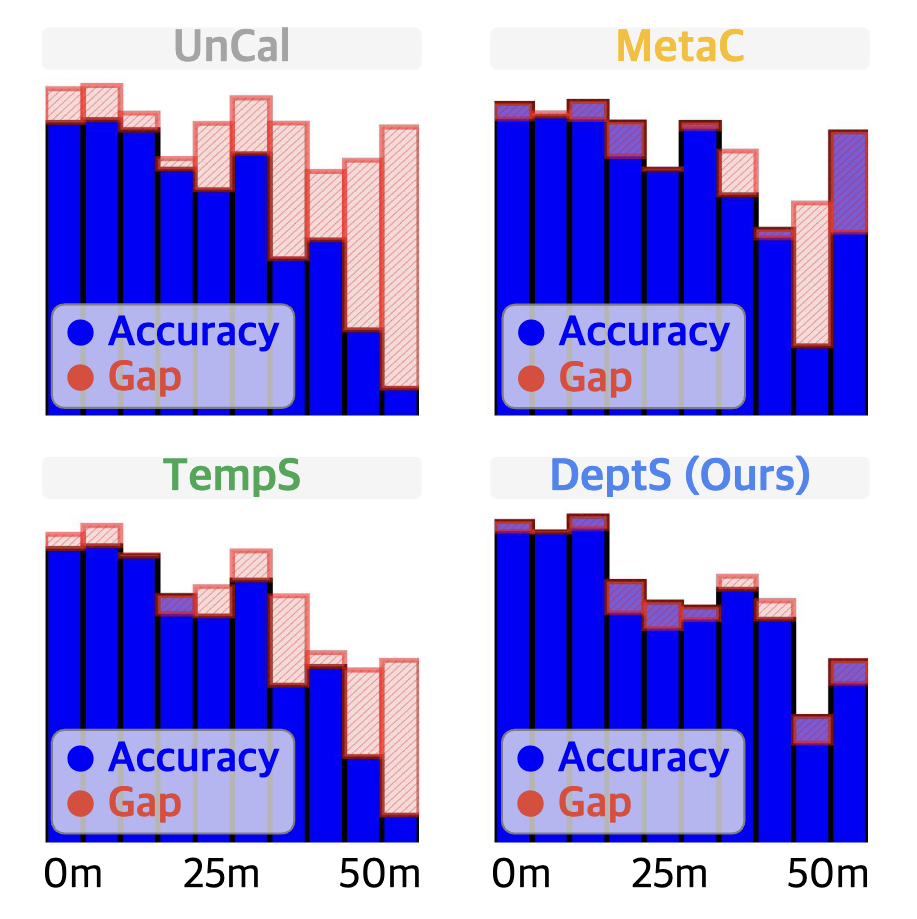 Figure 3.
Depth-wise confidence and accuracy statistics of uncalibrated (UnCal), temperature scaling (TempS), metacalibration (MetaC), and our proposed depth-aware scaling (DeptS) methods.
Figure 3.
Depth-wise confidence and accuracy statistics of uncalibrated (UnCal), temperature scaling (TempS), metacalibration (MetaC), and our proposed depth-aware scaling (DeptS) methods.
DeptS: Depth-Aware Scaling
While previous calibration methods have shown appealing calibration performance on image-based perception tasks, their effectiveness on 3D data remains unknown. Different from RGB images, the point cloud data are unordered and texture-less, which inherits extra difficulties in feature learning. We observe a close correlation among calibration error, prediction entropy, and depth - an inherent 3D information that can be calculated based on the Cartesian coordinates. To further consolidate this finding, we conduct a quantitative analysis of the relation between the calibration error and depth, which is depicted in Figure 3. We notice from the uncalibrated result that LiDAR points with large depth values (i.e., at the middle-to-far regions of the ego-vehicle) tend to have low accuracy. However, the confidence scores of the uncalibrated model do not decrease correspondingly, which in turn causes higher calibration errors.Table 1. The expected calibration error (ECE, the lower the better) of state-of-theart 3D scene understanding models on nuScenes and SemanticKITTI. UnCal, TempS, LogiS, DiriS, MetaC, and DeptS denote the uncalibrated, temperature, logistic, Dirichlet, meta, and our proposed depth-aware scaling calibrations, respectively.
| Method | Modal | UnCal | TempS | LogiS | DiriS | MetaC | DeptS | UnCal | TempS | LogiS | DiriS | MetaC | DeptS |
|---|---|---|---|---|---|---|---|---|---|---|---|---|---|
| RangeNet++ | Range 🔵 | 4.57% | 2.74% | 2.79% | 2.73% | 2.78% | 2.61% | 4.01% | 3.12% | 3.16% | 3.59% | 2.38% | 2.33% |
| SalsaNext | Range 🔵 | 3.27% | 2.59% | 2.58% | 2.57% | 2.52% | 2.42% | 5.37% | 4.29% | 4.31% | 4.11% | 3.35% | 3.19% |
| FIDNet | Range 🔵 | 4.89% | 3.35% | 2.89% | 2.61% | 4.55% | 4.33% | 5.89% | 4.04% | 4.15% | 3.82% | 3.25% | 3.14% |
| CENet | Range 🔵 | 4.44% | 2.47% | 2.53% | 2.58% | 2.70% | 2.44% | 5.95% | 3.93% | 3.79% | 4.28% | 3.31% | 3.09% |
| RangeViT | Range 🔵 | 2.52% | 2.50% | 2.57% | 2.56% | 2.46% | 2.38% | 5.47% | 3.16% | 4.84% | 8.80% | 3.14% | 3.07% |
| RangeFormer | Range 🔵 | 2.44% | 2.40% | 2.41% | 2.44% | 2.27% | 2.15% | 3.99% | 3.67% | 3.70% | 3.69% | 3.55% | 3.30% |
| FRNet | Range 🔵 | 2.27% | 2.24% | 2.22% | 2.28% | 2.22% | 2.17% | 3.46% | 3.53% | 3.54% | 3.49% | 2.83% | 2.75% |
| PolarNet | BEV 🔴 | 4.21% | 2.47% | 2.54% | 2.59% | 2.56% | 2.45% | 2.78% | 3.54% | 3.71% | 3.70% | 2.67% | 2.59% |
| MinkUNet18 | Voxel 🟡 | 2.45% | 2.34% | 2.34% | 2.42% | 2.29% | 2.23% | 3.04% | 3.01% | 3.08% | 3.30% | 2.69% | 2.63% |
| MinkUNet34 | Voxel 🟡 | 2.50% | 2.38% | 2.38% | 2.53% | 2.32% | 2.24% | 4.11% | 3.59% | 3.62% | 3.63% | 2.81% | 2.73% |
| Cylinder3D | Voxel 🟡 | 3.19% | 2.58% | 2.62% | 2.58% | 2.39% | 2.29% | 5.49% | 4.36% | 4.48% | 4.42% | 3.40% | 3.09% |
| SpUNet18 | Voxel 🟡 | 2.58% | 2.41% | 2.46% | 2.59% | 2.36% | 2.25% | 3.77% | 3.47% | 3.44% | 3.61% | 3.37% | 3.21% |
| SpUNet34 | Voxel 🟡 | 2.60% | 2.52% | 2.47% | 2.66% | 2.41% | 2.29% | 4.41% | 4.33% | 4.34% | 4.39% | 4.20% | 4.11% |
| RPVNet | Fusion 🟢 | 2.81% | 2.70% | 2.73% | 2.79% | 2.68% | 2.60% | 4.67% | 4.12% | 4.23% | 4.26% | 4.02% | 3.75% |
| 2DPASS | Fusion 🟢 | 2.74% | 2.53% | 2.51% | 2.51% | 2.62% | 2.46% | 2.32% | 2.35% | 2.45% | 2.30% | 2.73% | 2.27% |
| SPVCNN18 | Fusion 🟢 | 2.57% | 2.44% | 2.49% | 2.54% | 2.40% | 2.31% | 3.46% | 2.90% | 3.07% | 3.41% | 2.36% | 2.32% |
| SPVCNN34 | Fusion 🟢 | 2.61% | 2.49% | 2.54% | 2.61% | 2.37% | 2.28% | 3.61% | 3.03% | 3.07% | 3.10% | 2.99% | 2.86% |
| CPGNet | Fusion 🟢 | 3.33% | 3.11% | 3.17% | 3.15% | 3.07% | 2.98% | 3.93% | 3.81% | 3.83% | 3.78% | 3.70% | 3.59% |
| GFNet | Fusion 🟢 | 2.88% | 2.71% | 2.70% | 2.73% | 2.55% | 2.41% | 3.07% | 3.01% | 2.99% | 3.05% | 2.88% | 2.73% |
| UniSeg | Fusion 🟢 | 2.76% | 2.61% | 2.63% | 2.65% | 2.45% | 2.37% | 3.93% | 3.73% | 3.78% | 3.67% | 3.51% | 3.43% |
| KPConv | Point ⚫ | 3.37% | 3.27% | 3.34% | 3.32% | 3.28% | 3.20% | 4.97% | 4.88% | 4.90% | 4.91% | 4.78% | 4.68% |
| PIDS1.25× | Point ⚫ | 3.46% | 3.40% | 3.43% | 3.41% | 3.37% | 3.28% | 4.77% | 4.65% | 4.66% | 4.64% | 4.57% | 4.49% |
| PIDS2.0× | Point ⚫ | 3.53% | 3.47% | 3.49% | 3.51% | 3.34% | 3.27% | 4.91% | 4.83% | 4.72% | 4.89% | 4.66% | 4.47% |
| PTv2 | Point ⚫ | 2.42% | 2.34% | 2.46% | 2.55% | 2.48% | 2.19% | 4.95% | 4.78% | 4.71% | 4.94% | 4.69% | 4.62% |
| WaffleIron | Point ⚫ | 4.01% | 2.65% | 3.06% | 2.59% | 2.54% | 2.46% | 3.91% | 2.57% | 2.86% | 2.67% | 2.58% | 2.51% |
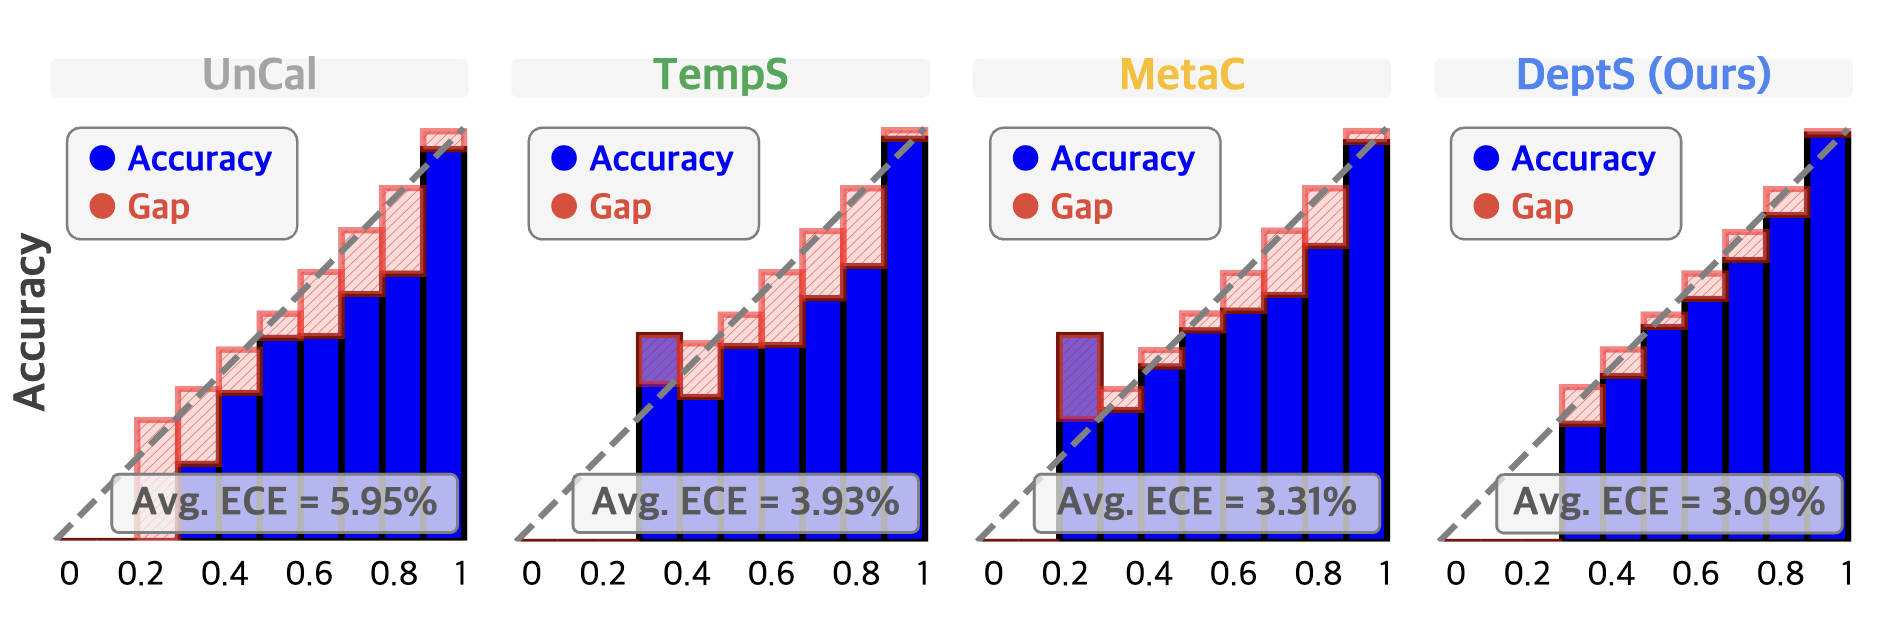 Figure 4.
The reliability diagrams of visualized calibration gaps from CENet on the validation set of SemanticKITTI.
UnCal, TempS, MetaC, and DeptS denote the uncalibrated, temperature, meta, and our depth-aware scaling calibrations, respectively.
Figure 4.
The reliability diagrams of visualized calibration gaps from CENet on the validation set of SemanticKITTI.
UnCal, TempS, MetaC, and DeptS denote the uncalibrated, temperature, meta, and our depth-aware scaling calibrations, respectively.
Table 2. The expected calibration error (ECE) of MinkUNet under eight domainshift scenarios from nuScenes-C and SemanticKITTI-C in the Robo3D benchmark. UnCal, TempS, LogiS, DiriS, MetaC, and DeptS denote the uncalibrated, temperature, logistic, Dirichlet, meta, and our depth-aware scaling calibrations, respectively.
| Type | nuScenes-C | SemanticKITTI-C | ||||||||||
|---|---|---|---|---|---|---|---|---|---|---|---|---|
| UnCal | TempS | LogiS | DiriS | MetaC | DeptS | UnCal | TempS | LogiS | DiriS | MetaC | DeptS | |
| Clean | 2.45% | 2.34% | 2.34% | 2.42% | 2.29% | 2.23% | 3.04% | 3.01% | 3.08% | 3.30% | 2.69% | 2.63% |
| Fog | 5.52% | 5.42% | 5.49% | 5.43% | 4.77% | 4.72% | 12.66% | 12.55% | 12.67% | 12.48% | 11.08% | 10.94% |
| Wet Ground | 2.63% | 2.54% | 2.54% | 2.64% | 2.55% | 2.52% | 3.55% | 3.46% | 3.54% | 3.72% | 3.33% | 3.28% |
| Snow | 13.79% | 13.32% | 13.53% | 13.59% | 11.37% | 11.31% | 7.10% | 6.96% | 6.95% | 7.26% | 5.99% | 5.63% |
| Motion Blur | 9.54% | 9.29% | 9.37% | 9.01% | 8.32% | 8.29% | 11.31% | 11.16% | 11.24% | 12.13% | 9.00% | 8.97% |
| Beam Missing | 2.58% | 2.48% | 2.49% | 2.57% | 2.53% | 2.47% | 2.87% | 2.83% | 2.84% | 2.98% | 2.83% | 2.79% |
| Crosstalk | 13.64% | 13.00% | 12.97% | 13.44% | 9.98% | 9.73% | 4.93% | 4.83% | 4.86% | 4.81% | 3.54% | 3.48% |
| Incomplete Echo | 2.44% | 2.33% | 2.33% | 2.42% | 2.32% | 2.21% | 3.21% | 3.19% | 3.25% | 3.48% | 2.84% | 2.19% |
| Cross Sensor | 4.25% | 4.15% | 4.20% | 4.28% | 4.06% | 3.20% | 3.15% | 3.13% | 3.18% | 3.43% | 3.17% | 2.96% |
| Average | 6.78% | 6.57% | 6.62% | 6.67% | 5.74% | 5.56% | 6.10% | 6.01% | 6.07% | 6.29% | 5.22% | 5.03% |
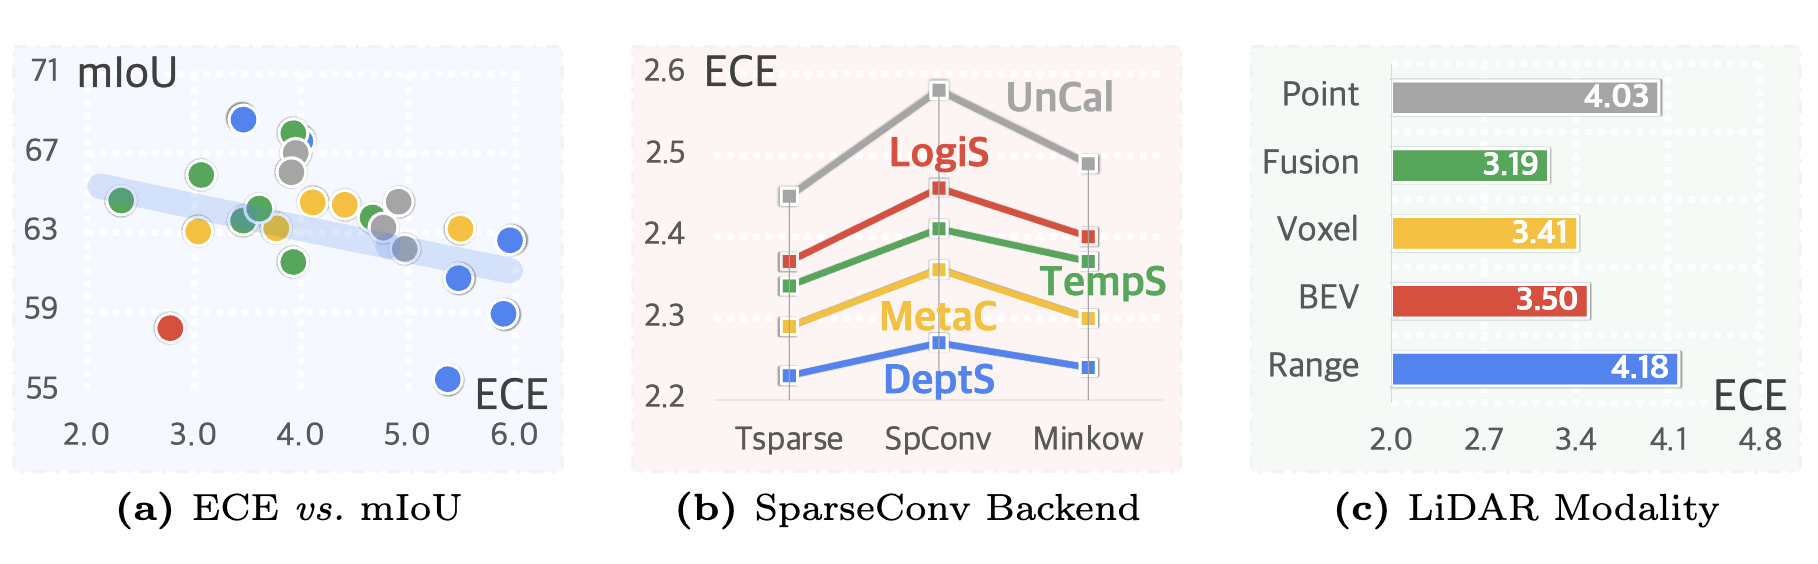 Figure 5.
Ablation studies on (a) relationships between calibration error and intersectionover-union scores, (b) calibration errors of MinkUNet using different sparse convolution backends, and (c) average calibration errors of different LiDAR representations.
Figure 5.
Ablation studies on (a) relationships between calibration error and intersectionover-union scores, (b) calibration errors of MinkUNet using different sparse convolution backends, and (c) average calibration errors of different LiDAR representations.
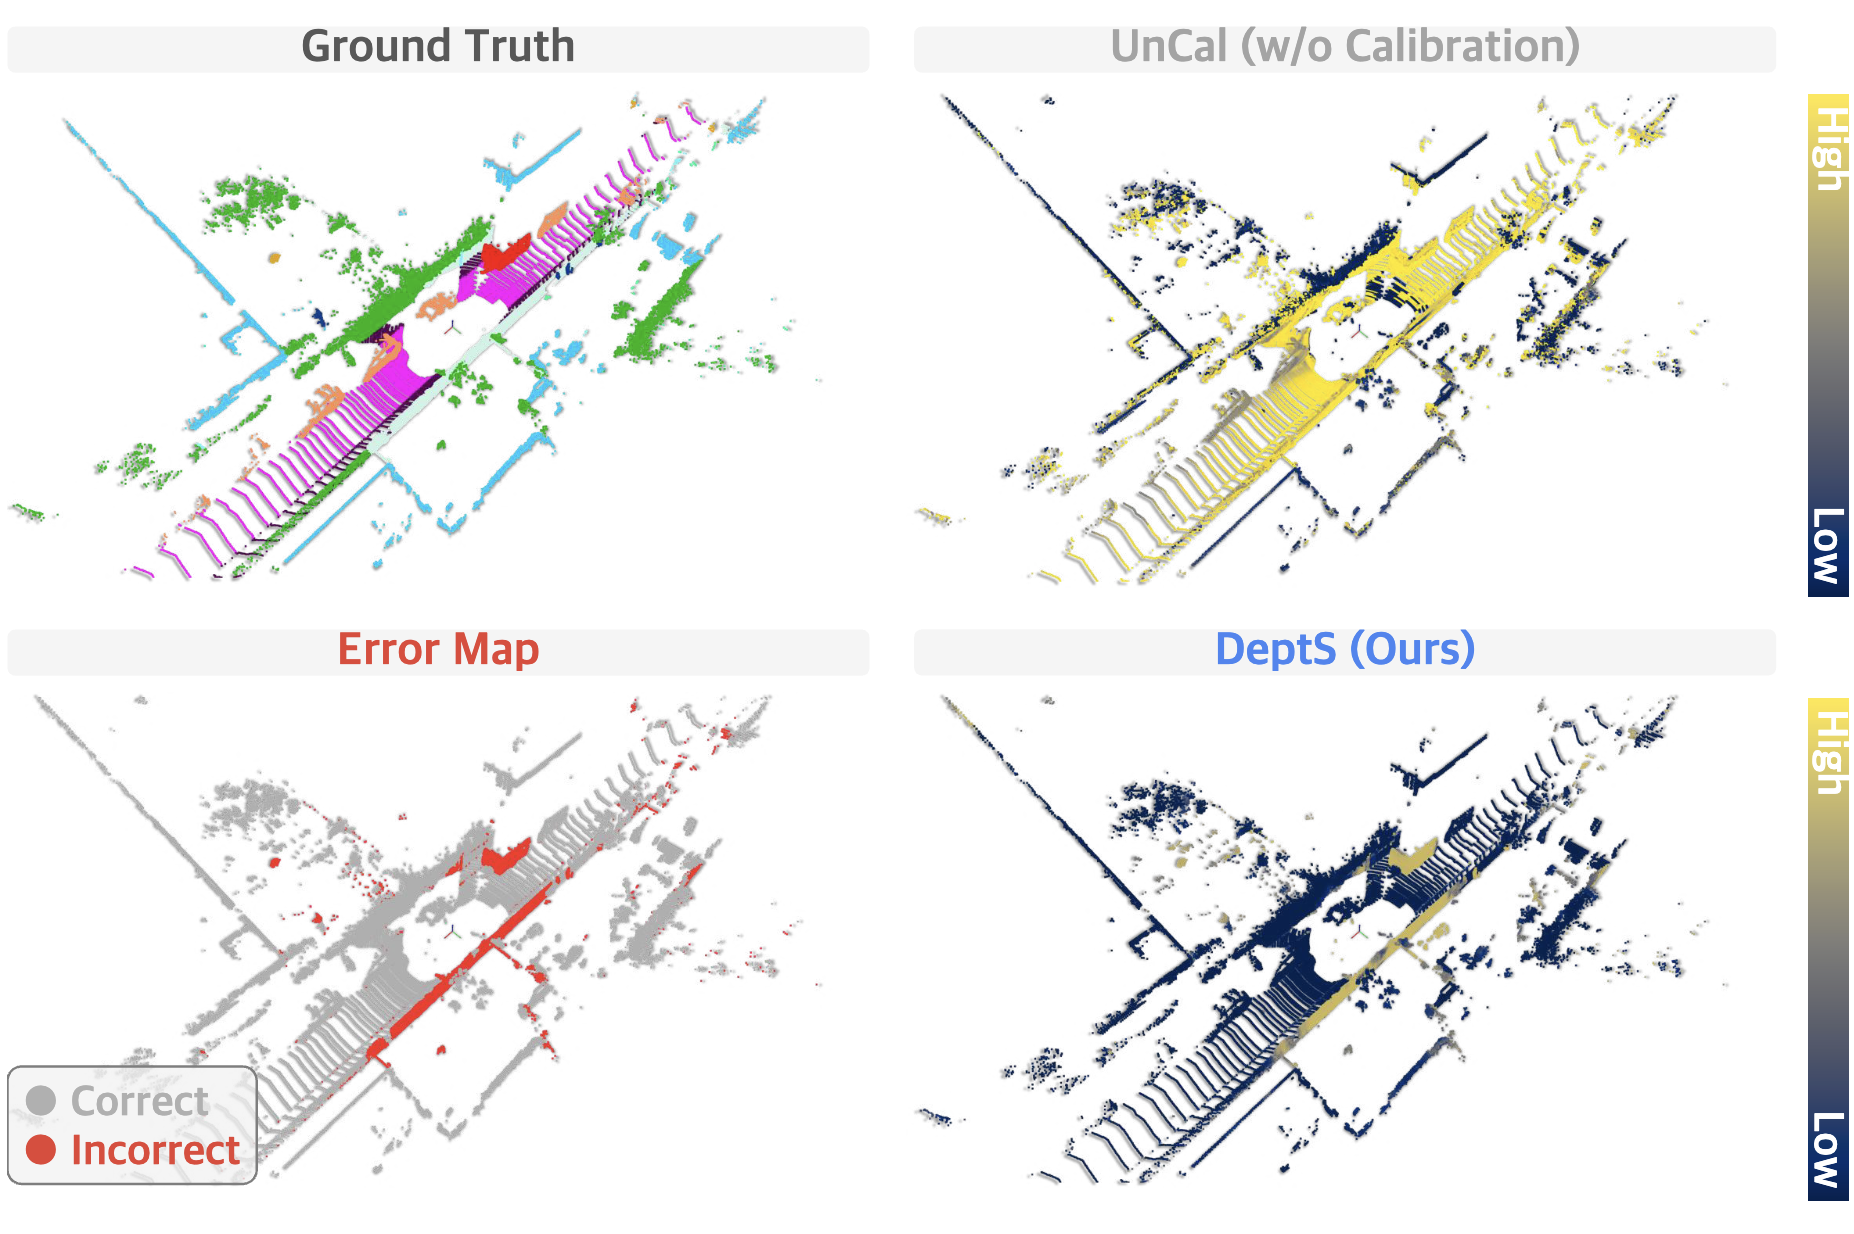 Figure 6.
The point-wise expected calibration error (ECE) of existing 3D semantic segmentation models without calibration (UnCal) and with our depth-aware scaling (DeptS).
Our approach is capable of delivering accurate uncertainty estimates.
The colormap goes from dark to light denotes low and high error rates, respectively.
Figure 6.
The point-wise expected calibration error (ECE) of existing 3D semantic segmentation models without calibration (UnCal) and with our depth-aware scaling (DeptS).
Our approach is capable of delivering accurate uncertainty estimates.
The colormap goes from dark to light denotes low and high error rates, respectively.
@inproceedings{kong2025calib3d,
    author = {Lingdong Kong and Xiang Xu and Jun Cen and Wenwei Zhang and Liang Pan and Kai Chen and Ziwei Liu},
    title = {Calib3D: Calibrating Model Preferences for Reliable 3D Scene Understanding},
    booktitle = {Proceedings of the IEEE/CVF Winter Conference on Applications of Computer Vision},
    pages = {1965-1978},
    year = {2025},
}