LargeAD: Large-Scale Cross-Sensor Data Pretraining for Autonomous Driving
- Lingdong Kong1,2,*
- Xiang Xu3,*
- Youquan Liu4,*
- Jun Cen5
- Runnan Chen6
- Wenwei Zhang1
- Liang Pan1
- Kai Chen1
- Ziwei Liu7
- 1Shanghai AI Laboratory
- 2National University of Singapore
- 3Nanjing University of Aeronautics and Astronautics
- 4Hochschule Bremerhaven
- 5The Hong Kong University of Science and Technology
- 6The University of Hong Kong
- 7S-Lab, Nanyang Technological University
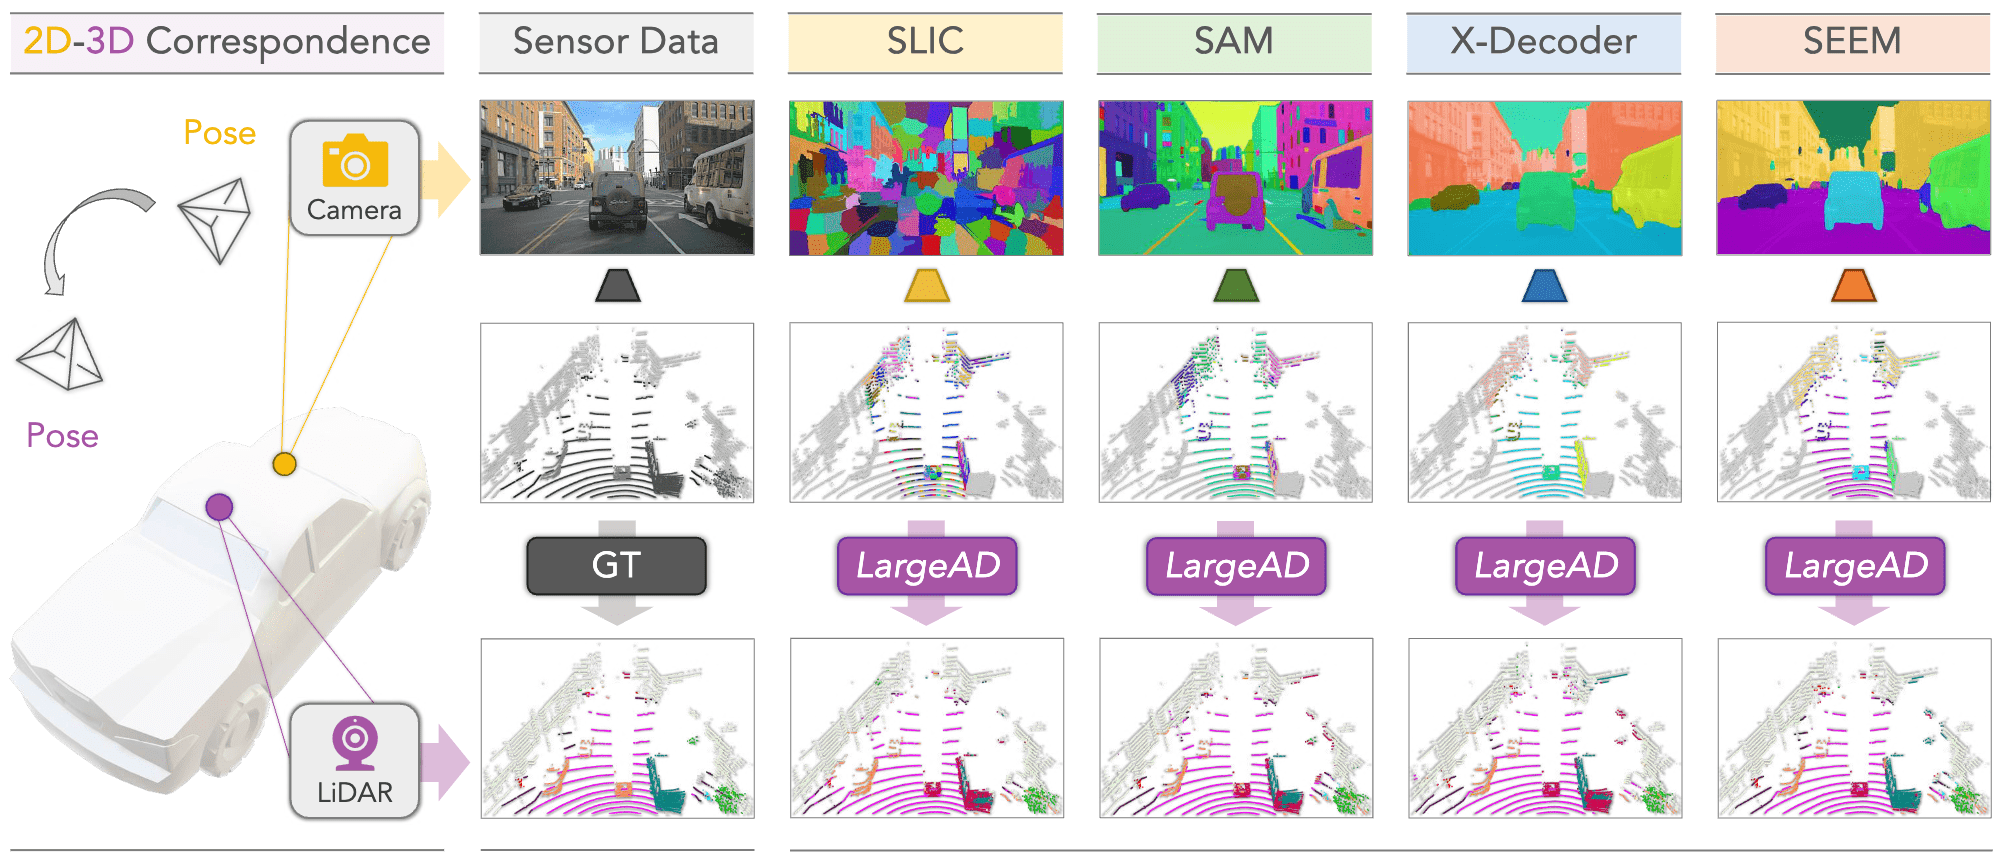
Figure 1. Illustration of image-to-LiDAR data pretraining using (i) the heuristic SLIC algorithm and (ii) different vision foundation models (VFMs). Images in the first row are the superpixels generated by different methods, where each color represents one distinct segment. The LiDAR point clouds from the second row are the superpoints grouped by projecting superpixels to 3D using camera-LiDAR correspondence. The third row shows the linear probing results after data pretraining.


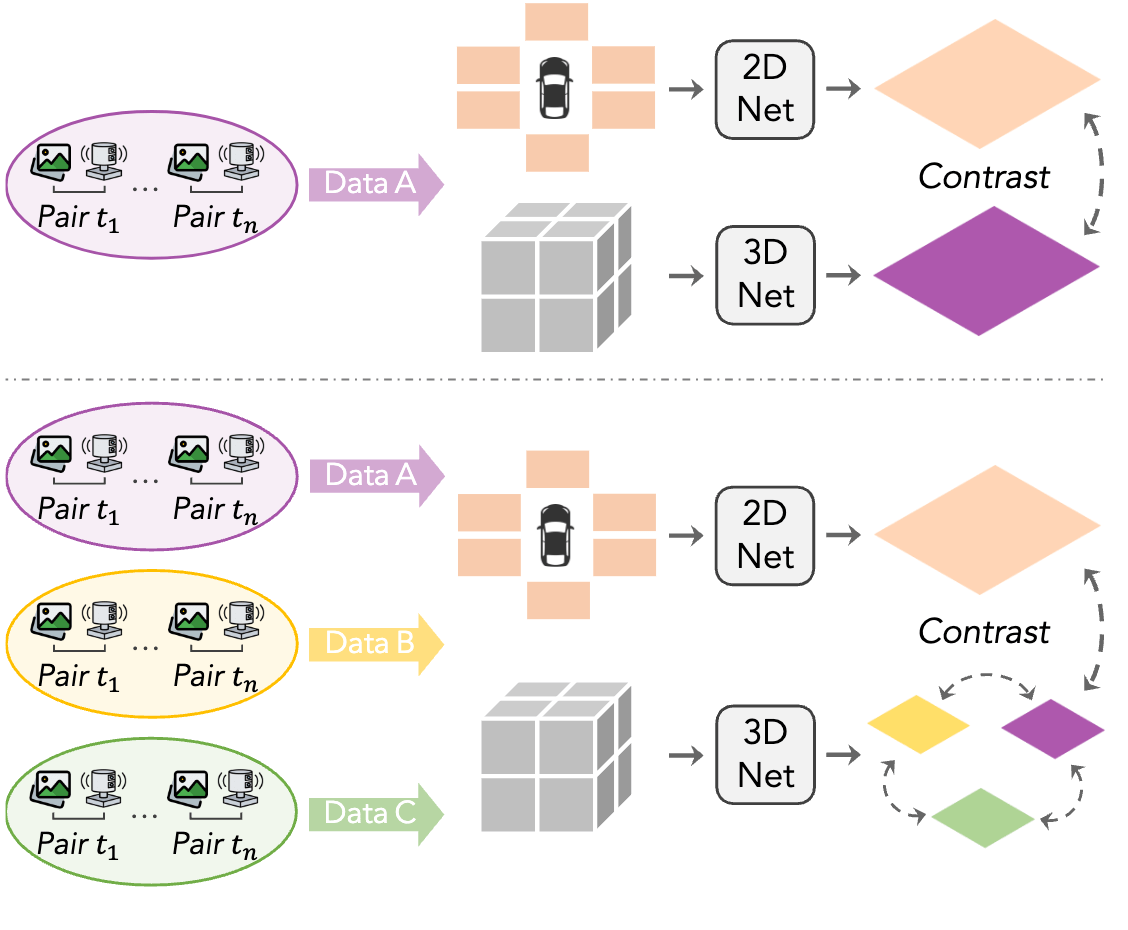 Figure 2. Comparisons between (i) the conventional image-to-LiDAR data pretraining frameworks and (ii) our proposed large-scale cross-sensor data pretraining (LargeAD).
Our approach builds on recent advances in cross-modal representation learning, incorporating VFMs into the 3D domain to address several critical objectives: (i) utilizing raw point clouds as input to eliminate the need for costly labels, (ii) exploiting spatial and temporal cues from driving scenes for robust representation learning, and (iii) ensuring generalizability to downstream datasets beyond the pretraining data. By distilling the semantic knowledge encoded in VFMs, our methodology facilitates self-supervised learning on complex 3D point clouds, particularly for autonomous driving. We combine heterogeneous data sources for representation learning, which achieves superior robustness and scalability. Different from previous work, our framework encourages representation learning across different datasets, which largely enhances the generalizability.
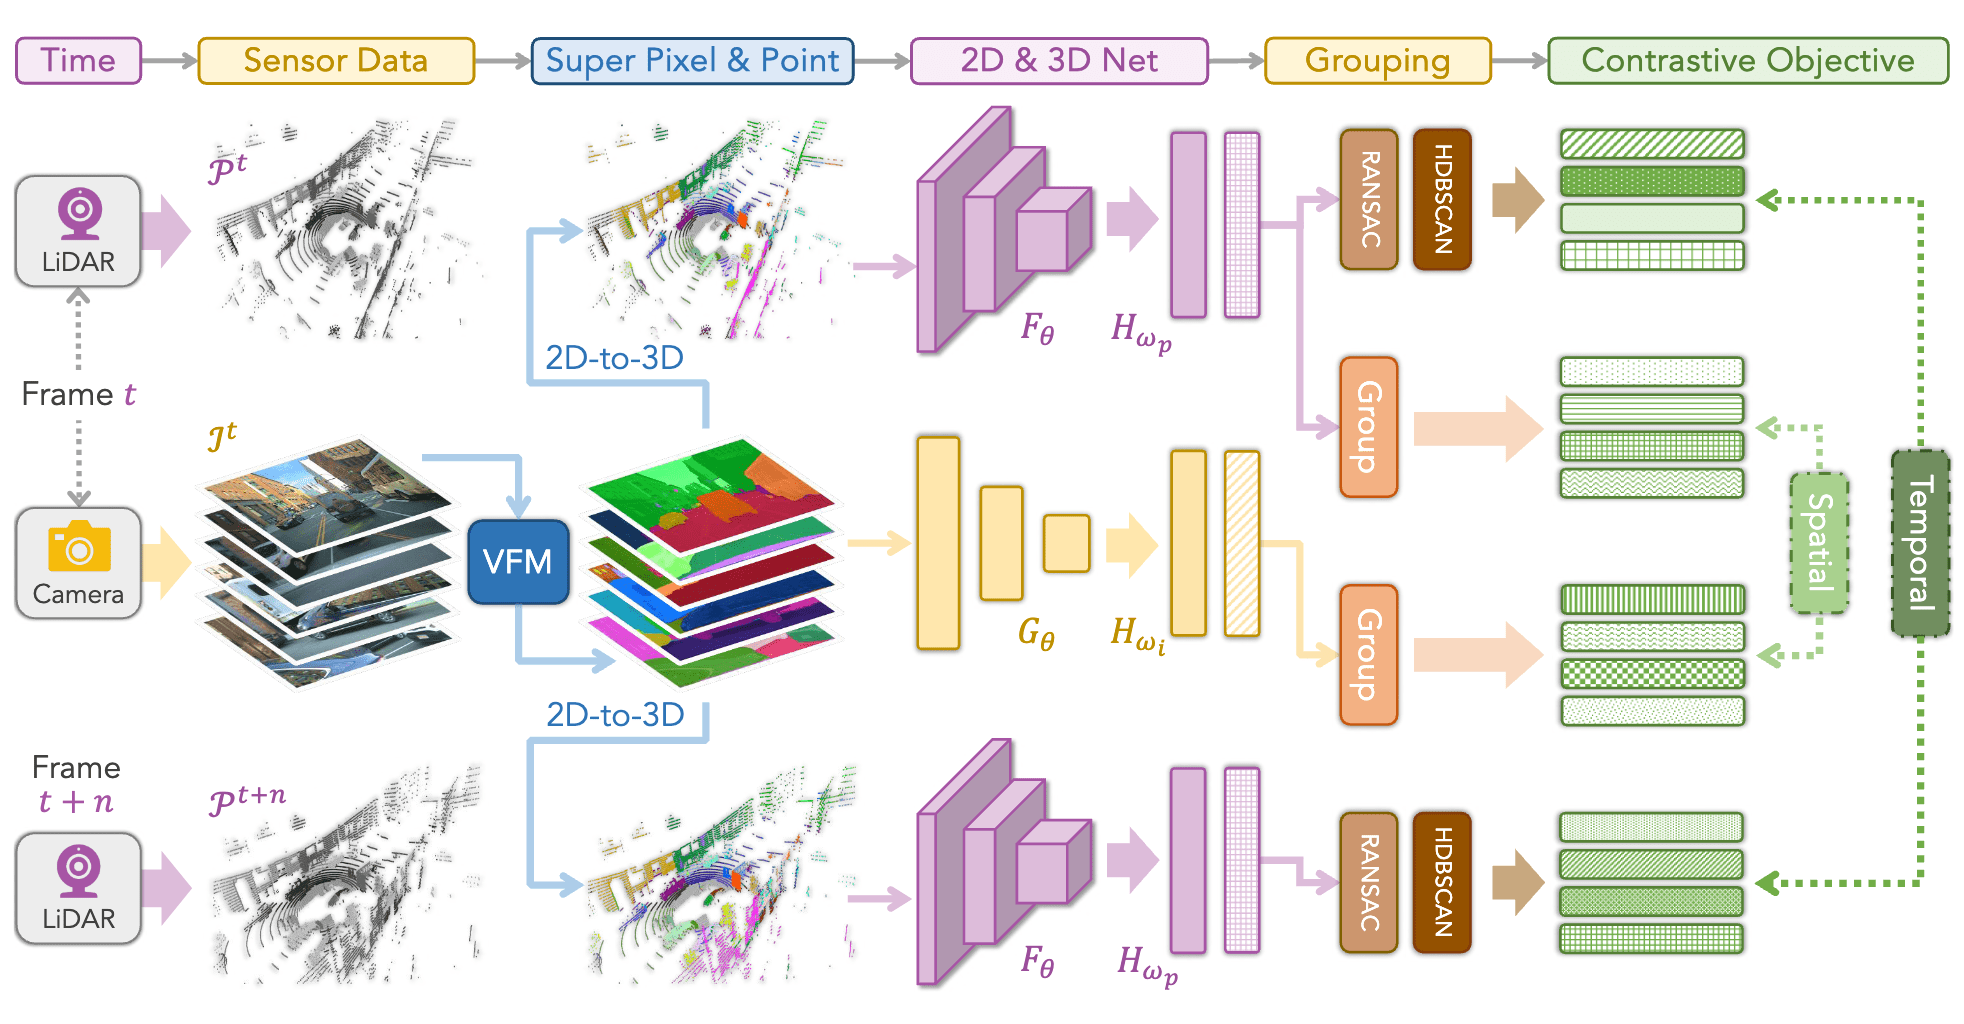 Figure 3. Overview of the VFM-driven image-to-LiDAR contrastive learning framework.
Given a pair of LiDAR point cloud and camera image captured at timestamp t, along with another LiDAR point cloud captured at timestamp t+n, we generate semantic superpixels using vision foundation models (VFMs).
The corresponding superpoints are obtained by projecting image pixels onto the point cloud. Two key objectives are established: (i) spatial contrastive learning between paired LiDAR and camera features, and (ii) temporal consistency regularization between point segments from t and t+n.
Figure 3. Overview of the VFM-driven image-to-LiDAR contrastive learning framework.
Given a pair of LiDAR point cloud and camera image captured at timestamp t, along with another LiDAR point cloud captured at timestamp t+n, we generate semantic superpixels using vision foundation models (VFMs).
The corresponding superpoints are obtained by projecting image pixels onto the point cloud. Two key objectives are established: (i) spatial contrastive learning between paired LiDAR and camera features, and (ii) temporal consistency regularization between point segments from t and t+n.
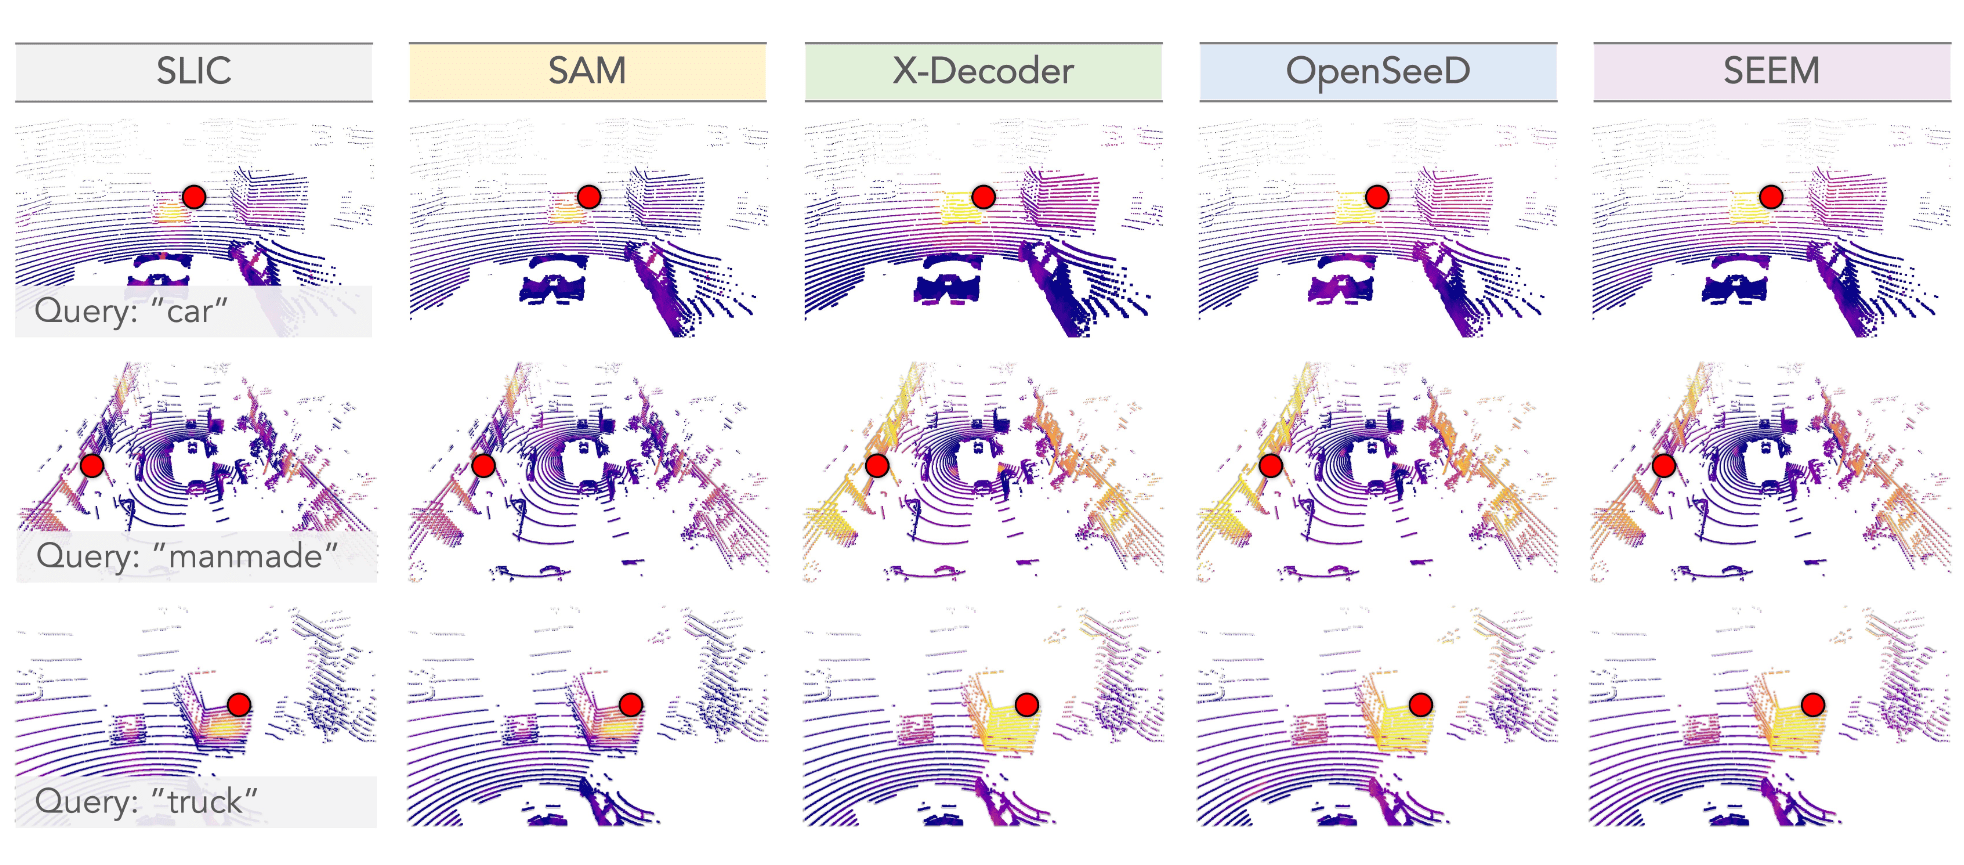 Figure 4. The cosine similarity between a query point (denoted as the red dot) and the feature learned with SLIC and different VFMs.
The queried semantic classes from top to bottom examples are: "car", "manmade", and "truck".
The color goes from violet to yellow denoting low and high similarity scores, respectively. Best viewed in colors.
Figure 4. The cosine similarity between a query point (denoted as the red dot) and the feature learned with SLIC and different VFMs.
The queried semantic classes from top to bottom examples are: "car", "manmade", and "truck".
The color goes from violet to yellow denoting low and high similarity scores, respectively. Best viewed in colors.
Table 1. Benchmark study of data pretraining methods that are pretrained on nuScenes and fine-tuned on nuScenes, SemanticKITTI, and Waymo Open. The evaluations are conducted on the official validation split of each dataset. Group (a): random initialization. Group (b): single-modality data pretraining. Group (c): image-to-LiDAR data pretraining by distilling ResNet. Groups (d), (e), and (f): image-to-LiDAR data pretraining by distilling ViT (Small, Medium, Large) from DINOv2. LP denotes linear probing with frozen backbones. All mIoU scores are given in percentage (%). The best scores are highlighted in bold.
| # | Method | Venue | Backbone | Backbone | nuScenes | KITTI | Waymo | |||||
|---|---|---|---|---|---|---|---|---|---|---|---|---|
| (2D) | (3D) | LP | 1% | 5% | 10% | 25% | Full | 1% | 1% | |||
| (a) | Random | - | - | MinkU-34 | 8.10 | 30.30 | 47.84 | 56.15 | 65.48 | 74.66 | 39.50 | 39.41 |
| (b) | PointContrast | ECCV'20 | - | MinkU-34 | 21.90 | 32.50 | - | - | - | - | 41.10 | - |
| DepthContrast | ICCV'21 | - | MinkU-34 | 22.10 | 31.70 | - | - | - | - | 41.50 | - | |
| ALSO | CVPR'23 | - | MinkU-34 | - | 37.70 | - | 59.40 | - | 72.00 | - | - | |
| BEVContrast | 3DV'24 | - | MinkU-34 | - | 38.30 | - | 59.60 | - | 72.30 | - | - | |
| (c) | PPKT | arXiv'21 | ResNet-50 | MinkU-34 | 35.90 | 37.80 | 53.74 | 60.25 | 67.14 | 74.52 | 44.00 | 47.60 |
| SLidR | CVPR'22 | ResNet-50 | MinkU-34 | 38.80 | 38.30 | 52.49 | 59.84 | 66.91 | 74.79 | 44.60 | 47.12 | |
| ST-SLidR | CVPR'23 | ResNet-50 | MinkU-34 | 40.48 | 40.75 | 54.69 | 60.75 | 67.70 | 75.14 | 44.72 | 44.93 | |
| TriCC | CVPR'23 | ResNet-50 | MinkU-34 | 38.00 | 41.20 | 54.10 | 60.40 | 67.60 | 75.60 | 45.90 | - | |
| Seal | NeurIPS'23 | ResNet-50 | MinkU-34 | 44.95 | 45.84 | 55.64 | 62.97 | 68.41 | 75.60 | 46.63 | 49.34 | |
| CSC | CVPR'24 | ResNet-50 | MinkU-34 | 46.00 | 47.00 | 57.00 | 63.30 | 68.60 | 75.70 | 47.20 | - | |
| HVDistill | IJCV'24 | ResNet-50 | MinkU-34 | 39.50 | 42.70 | 56.60 | 62.90 | 69.30 | 76.60 | 49.70 | - | |
| LargeAD | Ours | ResNet-50 | MinkU-34 | 46.13 | 47.08 | 56.90 | 63.74 | 69.34 | 76.03 | 49.55 | 50.29 | |
| (d) | PPKT | arXiv'21 | ViT-S | MinkU-34 | 38.60 | 40.60 | 52.06 | 59.99 | 65.76 | 73.97 | 43.25 | 47.44 |
| SLidR | CVPR'22 | ViT-S | MinkU-34 | 44.70 | 41.16 | 53.65 | 61.47 | 66.71 | 74.20 | 44.67 | 47.57 | |
| Seal | NeurIPS'23 | ViT-S | MinkU-34 | 45.16 | 44.27 | 55.13 | 62.46 | 67.64 | 75.58 | 46.51 | 48.67 | |
| ScaLR | CVPR'24 | ViT-S | MinkU-34 | 42.40 | 40.50 | - | - | - | - | - | - | |
| LargeAD | Ours | ViT-S | MinkU-34 | 46.58 | 46.78 | 57.33 | 63.85 | 68.66 | 75.75 | 50.07 | 50.83 | |
| (e) | PPKT | arXiv'21 | ViT-B | MinkU-34 | 39.95 | 40.91 | 53.21 | 60.87 | 66.22 | 74.07 | 44.09 | 47.57 |
| SLidR | CVPR'22 | ViT-B | MinkU-34 | 45.35 | 41.64 | 55.83 | 62.68 | 67.61 | 74.98 | 45.50 | 48.32 | |
| Seal | NeurIPS'23 | ViT-B | MinkU-34 | 46.59 | 45.98 | 57.15 | 62.79 | 68.18 | 75.41 | 47.24 | 48.91 | |
| LargeAD | Ours | ViT-B | MinkU-34 | 47.84 | 48.37 | 59.36 | 64.11 | 69.02 | 75.91 | 50.68 | 51.52 | |
| (f) | PPKT | arXiv'21 | ViT-L | MinkU-34 | 41.57 | 42.05 | 55.75 | 61.26 | 66.88 | 74.33 | 45.87 | 47.82 |
| SLidR | CVPR'22 | ViT-L | MinkU-34 | 45.70 | 42.77 | 57.45 | 63.20 | 68.13 | 75.51 | 47.01 | 48.60 | |
| Seal | NeurIPS'23 | ViT-L | MinkU-34 | 46.81 | 46.27 | 58.14 | 63.27 | 68.67 | 75.66 | 47.55 | 50.02 | |
| LargeAD | Ours | ViT-L | MinkU-34 | 48.71 | 49.21 | 60.37 | 64.82 | 69.85 | 75.94 | 51.68 | 52.68 | |
Table 2. Benchmark study of data pretraining methods that are: (a) random initialized, (b) pretrained on SemanticKITTI, (c) pretrained on Waymo Open, and (d) pretrained based on the proposed large-scale cross-sensor data pretraining pipeline. After pretraining, all methods are fine-tuned on SemanticKITTI, nuScenes, and Waymo Open, respectively, and evaluated on the official validation split of each dataset. LP denotes linear probing with frozen backbones. All mIoU scores are given in percentage (%). The best score under each group is highlighted in bold.
| # | Method | Venue | Distill | SemanticKITTI | nuScenes | Waymo | |||||||||
|---|---|---|---|---|---|---|---|---|---|---|---|---|---|---|---|
| LP | 1% | 10% | Full | LP | 1% | 10% | Full | LP | 1% | 10% | Full | ||||
| (a) | Random | - | - | 7.45 | 39.50 | 55.11 | 57.39 | 8.10 | 30.30 | 56.15 | 74.66 | 6.45 | 39.41 | 59.71 | 64.22 |
| (b) | SLidR | CVPR'22 | ViT-B | 32.83 | 45.20 | 56.18 | 56.60 | 16.54 | 35.21 | 56.77 | 74.47 | 27.82 | 44.35 | 60.55 | 64.33 |
| Seal | NeurIPS'23 | ViT-B | 33.46 | 47.52 | 57.68 | 58.64 | 18.18 | 38.86 | 58.05 | 74.53 | 29.36 | 45.96 | 61.59 | 64.81 | |
| (c) | SLidR | CVPR'22 | ViT-B | 32.29 | 44.75 | 55.66 | 57.49 | 23.97 | 39.16 | 58.47 | 73.96 | 32.21 | 47.96 | 61.33 | 64.43 |
| Seal | NeurIPS'23 | ViT-B | 33.21 | 47.46 | 57.61 | 58.72 | 25.74 | 42.69 | 60.59 | 74.38 | 34.65 | 49.30 | 62.37 | 65.79 | |
| (d) | LargeAD | Ours | ViT-B | 35.77 | 50.68 | 60.18 | 60.98 | 47.84 | 48.37 | 64.11 | 75.91 | 36.12 | 51.52 | 63.92 | 66.10 |
Table 3. Benchmark study of data pretraining methods that are: (a) random initialized, (b) pretrained on nuScenes, (c) pretrained on SemanticKITTI, (d) pretrained on Waymo Open, and (e) pretrained based on the proposed large-scale cross-sensor data pretraining pipeline. After pretraining, all methods are fine-tuned on different downstream datasets, respectively, and evaluated on the official validation split of each dataset. All mIoU scores are given in percentage (%). The best scores are highlighted in bold.
| # | Method | ScribbleKITTI | RELLIS-3D | SemanticPOSS | SemanticSTF | SynLiDAR | DAPS-3D | Synth4D | |||||||
|---|---|---|---|---|---|---|---|---|---|---|---|---|---|---|---|
| 1% | 10% | 1% | 10% | Half | Full | Half | Full | 1% | 10% | Half | Full | 1% | 10% | ||
| (a) | Random | 23.81 | 47.60 | 38.46 | 53.60 | 46.26 | 54.12 | 48.03 | 48.15 | 19.89 | 44.74 | 74.32 | 79.38 | 20.22 | 66.87 |
| (b) | PPKT | 36.50 | 51.67 | 49.71 | 54.33 | 50.18 | 56.00 | 50.92 | 54.69 | 37.57 | 46.48 | 78.90 | 84.00 | 61.10 | 62.41 |
| SLidR | 39.60 | 50.45 | 49.75 | 54.57 | 51.56 | 55.36 | 52.01 | 54.35 | 42.05 | 47.84 | 81.00 | 85.40 | 63.10 | 62.67 | |
| Seal | 40.64 | 52.77 | 51.09 | 55.03 | 53.26 | 56.89 | 53.46 | 55.36 | 43.58 | 49.26 | 81.88 | 85.90 | 64.50 | 66.96 | |
| (c) | SLidR | 40.27 | 51.92 | 47.65 | 54.03 | 49.97 | 54.83 | 51.39 | 53.83 | 40.11 | 43.90 | 74.93 | 80.31 | 57.24 | 61.25 |
| Seal | 41.97 | 53.25 | 49.23 | 54.93 | 52.31 | 55.47 | 53.26 | 55.49 | 41.48 | 45.52 | 76.31 | 81.24 | 59.25 | 64.21 | |
| (d) | SLidR | 38.24 | 48.96 | 47.31 | 53.20 | 50.93 | 55.04 | 50.93 | 54.35 | 43.91 | 49.32 | 79.02 | 84.34 | 61.98 | 62.15 |
| Seal | 39.13 | 50.53 | 50.55 | 54.68 | 52.90 | 55.27 | 52.20 | 55.24 | 44.78 | 50.98 | 79.68 | 84.68 | 63.74 | 65.39 | |
| (e) | LargeAD | 43.45 | 54.62 | 53.31 | 56.62 | 54.47 | 57.11 | 55.14 | 56.89 | 47.12 | 52.82 | 83.31 | 86.21 | 65.33 | 67.12 |
Table 4. Robustness probing of data pretraining methods under eight out-of-distribution corruptions in the nuScenes-C dataset from the Robo3D benchmark. The mCE score is the lower the better while mRR and mIoU scores are the higher the better. All mCE, mRR, and mIoU scores are given in percentage (%). Avg denotes the average mIoU scores of methods across all eight corruptions. The best score under each setting is highlighted in bold.
| # | Initial | Backbone | mCE | mRR | Fog | Wet | Snow | Move | Beam | Cross | Echo | Sensor | Avg |
|---|---|---|---|---|---|---|---|---|---|---|---|---|---|
| LP | PPKT | MinkU-34 | 183.44 | 78.15 | 30.65 | 35.42 | 28.12 | 29.21 | 32.82 | 19.52 | 28.01 | 20.71 | 28.06 |
| SLidR | MinkU-34 | 179.38 | 77.18 | 34.88 | 38.09 | 32.64 | 26.44 | 33.73 | 20.81 | 31.54 | 21.44 | 29.95 | |
| Seal | MinkU-34 | 166.18 | 75.38 | 37.33 | 42.77 | 29.93 | 37.73 | 40.32 | 20.31 | 37.73 | 24.94 | 33.88 | |
| LargeAD | MinkU-34 | 160.28 | 77.29 | 40.54 | 43.26 | 37.92 | 38.27 | 40.27 | 25.67 | 39.26 | 30.62 | 36.98 | |
| Full | Random | PolarNet | 115.09 | 76.34 | 58.23 | 69.91 | 64.82 | 44.60 | 61.91 | 40.77 | 53.64 | 42.01 | 54.49 |
| Random | CENet | 112.79 | 76.04 | 67.01 | 69.87 | 61.64 | 58.31 | 49.97 | 60.89 | 53.31 | 24.78 | 55.72 | |
| Random | WaffleIron | 106.73 | 72.78 | 56.07 | 73.93 | 49.59 | 59.46 | 65.19 | 33.12 | 61.51 | 44.01 | 55.36 | |
| Random | Cylinder3D | 105.56 | 78.08 | 61.42 | 71.02 | 58.40 | 56.02 | 64.15 | 45.36 | 59.97 | 43.03 | 57.42 | |
| Random | SPVCNN-34 | 106.65 | 74.70 | 59.01 | 72.46 | 41.08 | 58.36 | 65.36 | 36.83 | 62.29 | 49.21 | 55.58 | |
| Random | MinkU-34 | 112.20 | 72.57 | 62.96 | 70.65 | 55.48 | 51.71 | 62.01 | 31.56 | 59.64 | 39.41 | 54.18 | |
| PPKT | MinkU-34 | 105.64 | 76.06 | 64.01 | 72.18 | 59.08 | 57.17 | 63.88 | 36.34 | 60.59 | 39.57 | 56.60 | |
| SLidR | MinkU-34 | 106.08 | 75.99 | 65.41 | 72.31 | 56.01 | 56.07 | 62.87 | 41.94 | 61.16 | 38.90 | 56.83 | |
| Seal | MinkU-34 | 92.63 | 83.08 | 72.66 | 74.31 | 66.22 | 66.14 | 65.96 | 57.44 | 59.87 | 39.85 | 62.81 | |
| LargeAD | MinkU-34 | 91.75 | 83.61 | 71.95 | 72.47 | 67.28 | 65.29 | 67.49 | 59.42 | 61.38 | 42.46 | 63.47 |
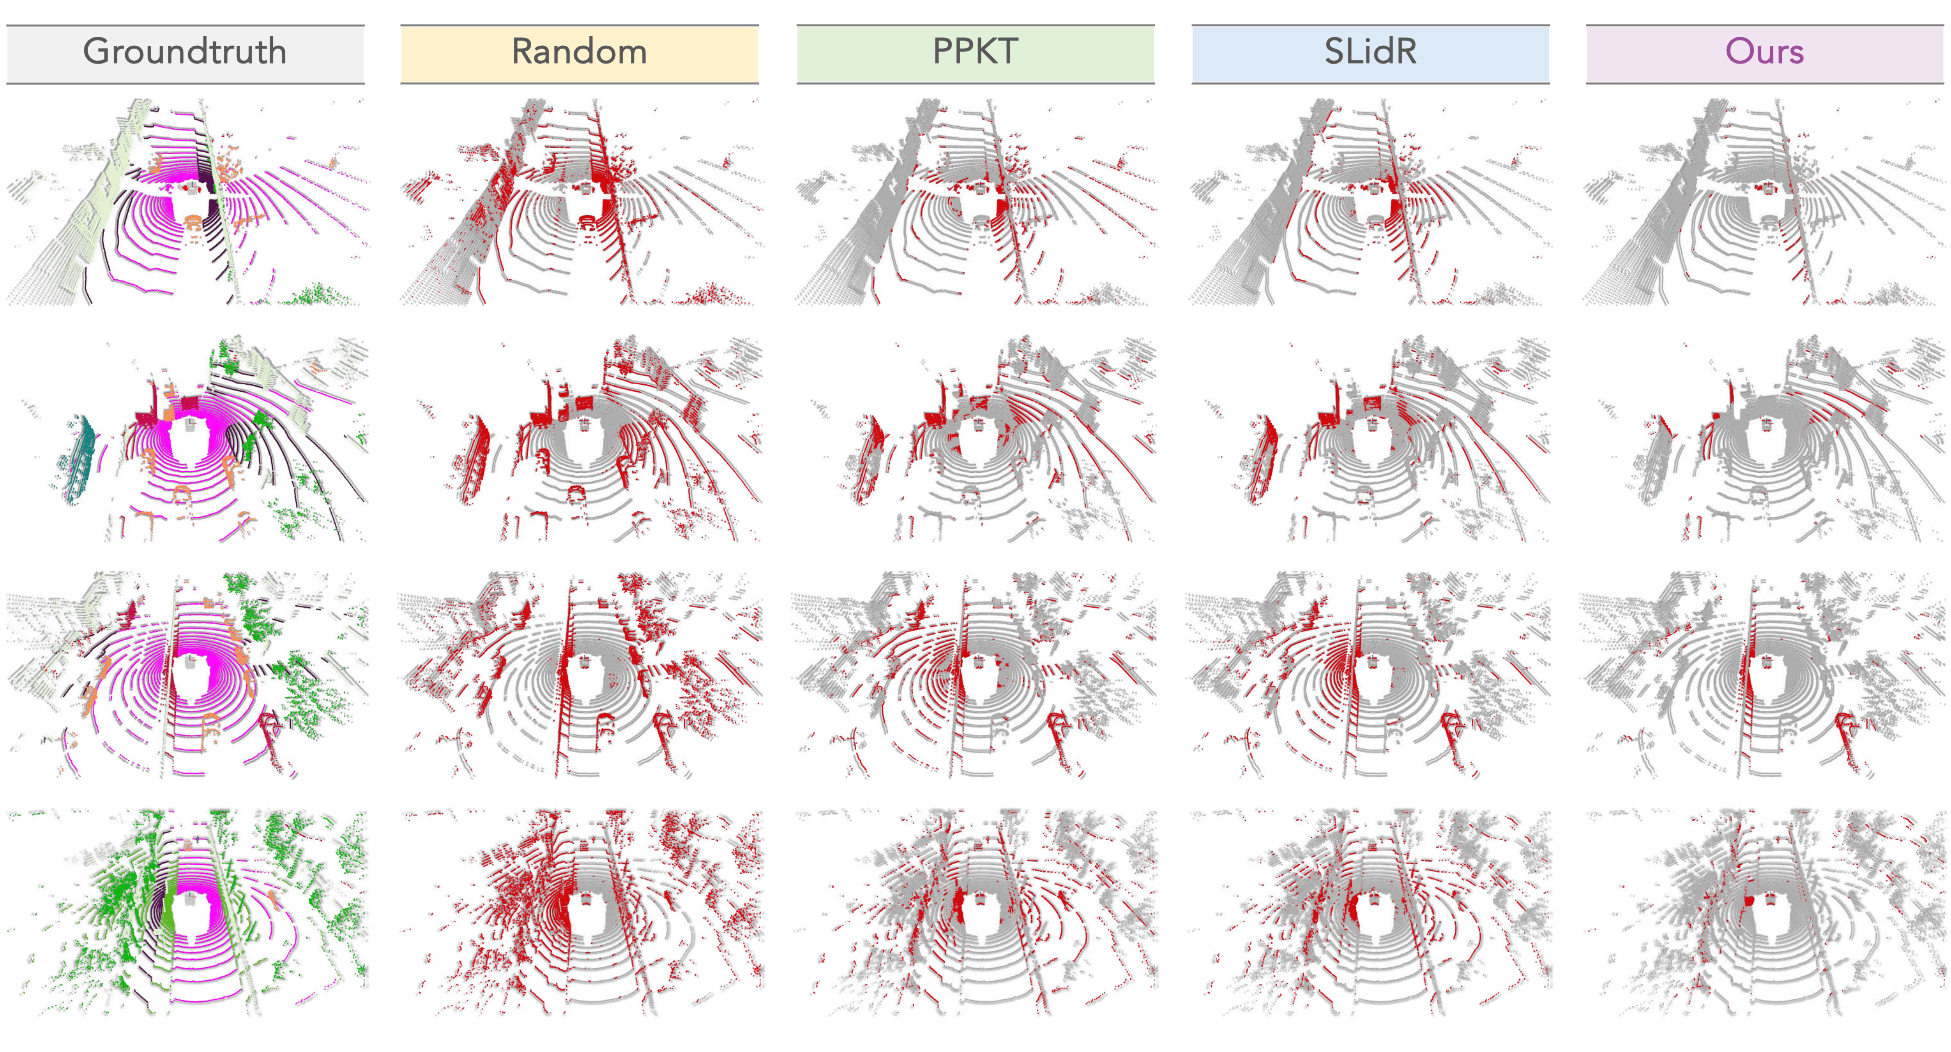 Figure 5. The qualitative results of random initialization and different image-to-LiDAR data pretraining approaches pretrained and fine-tuned (with 1% labeled data) on nuScenes.
To highlight the differences, the correct / incorrect predictions are painted in gray / red, respectively.
Best viewed in colors and zoomed-in for additional details.
Figure 5. The qualitative results of random initialization and different image-to-LiDAR data pretraining approaches pretrained and fine-tuned (with 1% labeled data) on nuScenes.
To highlight the differences, the correct / incorrect predictions are painted in gray / red, respectively.
Best viewed in colors and zoomed-in for additional details.
@article{kong2025largead,
    title={LargeAD: Large-Scale Cross-Sensor Data Pretraining for Autonomous Driving},
    author={Kong, Lingdong and Xu, Xiang and Liu, Youquan and Cen, Jun and Chen, Runnan and Zhang, Wenwei and Pan, Liang and Chen, Kai and Liu, Ziwei},
    journal={arXiv preprint arXiv:2501.04005},
    year={2025}
}