About
CAT is a specialized dataset for co-saliency detection - one of the core tasks in the field of computer vision. Our dataset is intended for both helping to assess the performance of vision algorithms and supporting research that aims to exploit large volumes of annotated data, e.g., for training deep neural networks. Click here or read our paper for more details.
Basic Statistics
Scale & Features
- A total number of 33500 image samples.
- 280 semantic groups affiliated to 15 superclasses.
- High-quality mask annotations.
- Diverse visual context with multiple foreground objects.
Superclasses
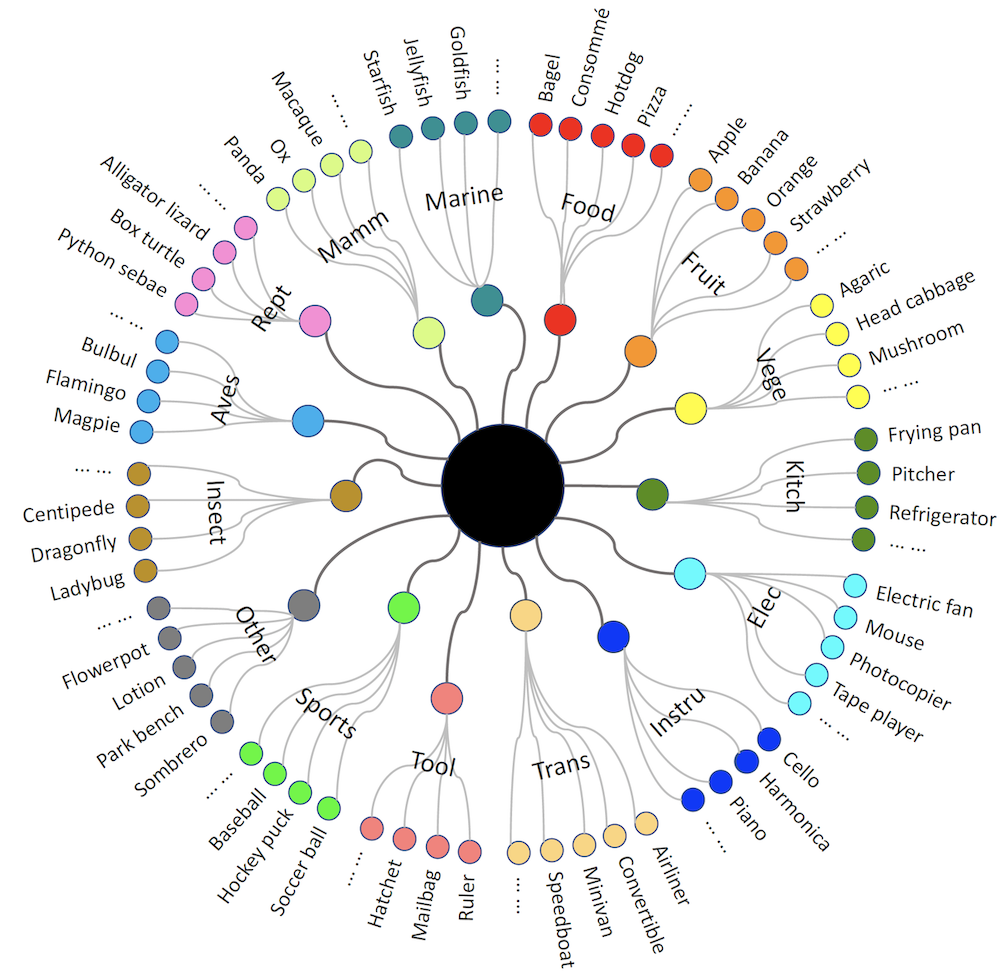
CAT consists of 15 superclasses, i.e., aves, electronic product (elec.), food, fruit, insect, instrument (instru.), kitchenware (kitch.), mammal (mamm.), marine, other, reptile (rept.), sports, tool, transportation (trans.), and vegetable (vege.). Specifically, mammal occupies 73 of the 280 semantic groups (23%), which is the largest among the 15 superclasses. The second-largest is aves, which consists of 56 semantic groups (20%). The remaining superclasses occupy a total of 54% subclasses, of which the smallest two are marine and vegetable, each containing four semantic groups. In general, the 15 superclasses in our dataset cover a large number of categories in different fields. More details are available here.
Subclasses
CAT contains 280 subclasses (semantic groups), of which range from biological species and daily necessities. Specifically, each semantic group in our dataset is a collection of one specific item/species. These items/species usually have a uniform appearance, such as a specific shape, color, texture, etc. Thanks to the powerful pre-training models, these species are automatically classified to form diverse semantic groups. The average number of images per group is 119.6. Among all the semantic groups, apple is the largest one with 824 images, while boston terrier and cell phone are the smallest, which contain 28 images. Such a distribution is in line with that of the recent evaluation datasets, i.e., CoSOD3k (Fan et al. 2020) and CoCA (Zhang et al. 2020). The maximum/minimum numbers of images per group for these two datasets are 30/4 and 40/8, respectively. More details on these semantic groups and their representative examples are available on our webpage.
Statistical Comparisons
| Dataset | Year | # Img. | # Cat. | # Avg. | # Max. | # Min. | Mul. | Sal. | Larg. | H.Q. | Type |
|---|---|---|---|---|---|---|---|---|---|---|---|
| MSRC | 2005 | 240 | 8 | 30.0 | 30 | 30 | no | yes | no | no | CO |
| iCoseg | 2010 | 643 | 38 | 16.9 | 41 | 4 | no | yes | no | yes | CO |
| CoSal2015 | 2015 | 2015 | 50 | 40.3 | 52 | 26 | yes | yes | no | yes | CO |
| DUTS-TR | 2017 | 10553 | - | - | - | - | no | yes | yes | yes | SD |
| COCO9213 | 2017 | 9213 | 65 | 141.7 | 468 | 18 | yes | yes | no | no | SS |
| COCO-GWD | 2019 | 9000 | 118 | 76.2 | - | - | yes | yes | no | no | SS |
| COCO-SEG | 2019 | 200932 | 78 | 2576.1 | 49355 | 201 | yes | no | yes | no | SS |
| WISD | 2019 | 2019 | - | - | - | - | yes | - | no | - | CO |
| DUTS-Class | 2020 | 8250 | 291 | 28.3 | 252 | 5 | no | yes | yes | yes | CO |
| CAT | 2021 | 33500 | 280 | 119.6 | 824 | 28 | yes | yes | yes | yes | CO |
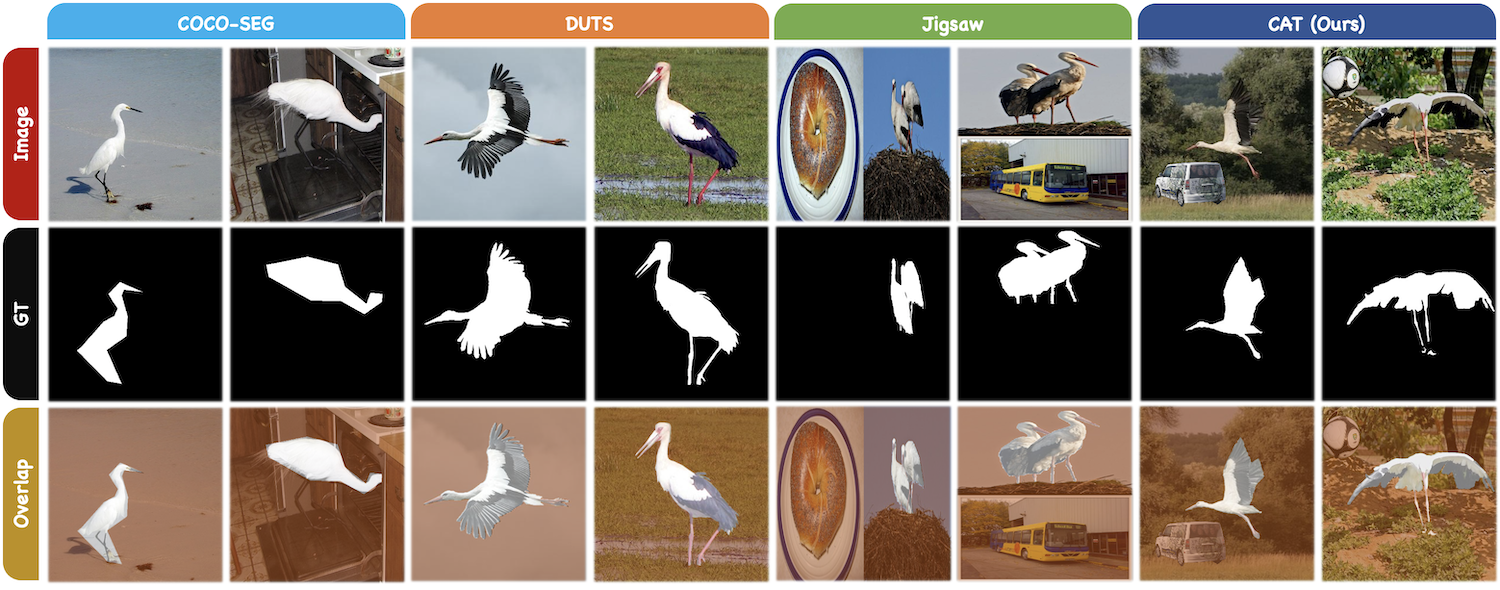
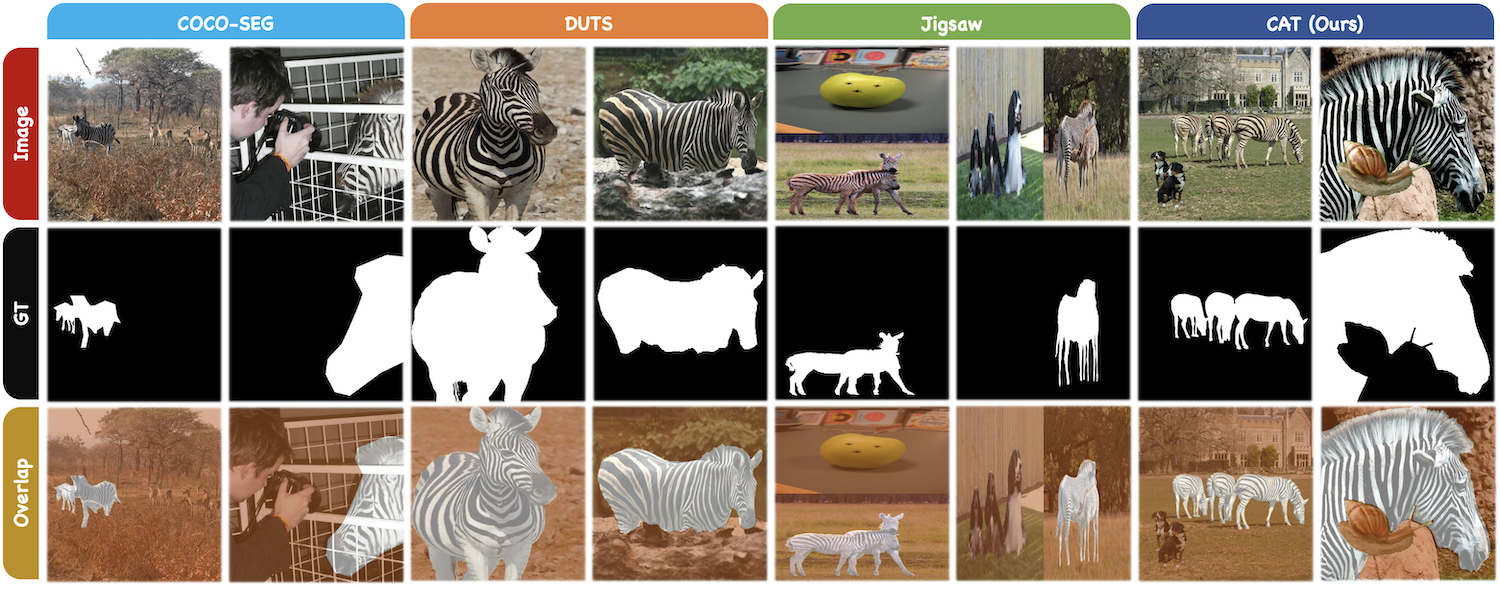
Visual Comparisons
Semantic Group: 'White Stork'
Semantic Group: 'Zebra'
Reference
@article{kong2021free,
  title={Free Lunch for Co-Saliency Detection: Context Adjustment},
  author={Kong, Lingdong and Ganesh, Prakhar and Wang, Tan and Liu, Junhao and Chen, Yao and Zhang, Le},
  journal={arXiv preprint arXiv:2108.02093},
  year={2021}
}
Contact
We welcome and cherish every feedback and are open to discussion! Please send via cat.cosaliency@gmail.com.